Dance of a Tiger:
Multi-dimensional Mapping of Migration Tracks of Pelagic Species
Jiayi Young in collaboration with Shih-Wen Young, and sound artists Natalie Bewernitz and Marek Goldowski (2013 and 2017)
2012: 6-channel data sonification study, Museum of Contemporary Art, Zagreb, Croatia
2013: 8-channel data soundscape, Moltkerei Werkstatt, Cologne, Germany, through Stadt Köln Kunst und Kultur artist residency program
2017: 8-channel soundscape and 3-channel panoramic video projection, AG gallery, University of Florida, FL
By mapping migration tracks of pelagic (open-ocean) species over time and across geographic locations, this project is interested in engaging the public to experience a visual and audible immersive environment that reflects the lives of marine animals in the oceans. In 2012 and 2013, we used data extracted from the live Tagging of Pacific Predators (TOPP) project and mapped migration activities of pelagic species of one Salmon Shark and three Northern Elephant Seals over the course of a two-year period (Jan. 2011-Jan. 2013) in the context of corresponding Sea Surface Temperature (SST) change of the shark’s tagged positions [1][2][3]. In the presence of increased concerns of overfishing, in 2017, we created a multi-dimensional immersive environment consisting of an 8-channel soundscape and a 3-channel panoramic video projection that mapped migration tracks of Bluefin tunas in the context of fishing vessel routes in an area of the Indian Ocean where the stock is being overfished and is at risk of collapse.
TOPP began in 2000 as one of 17 projects of the Census of Marine Life, a 10-year, 80-nation endeavor to assess and explain the diversity and abundance of life in the oceans, and where that life has lived, is living, and will live. Tagged animals send back data via satellites such as Argos, a polar-orbiting satellite.[4]

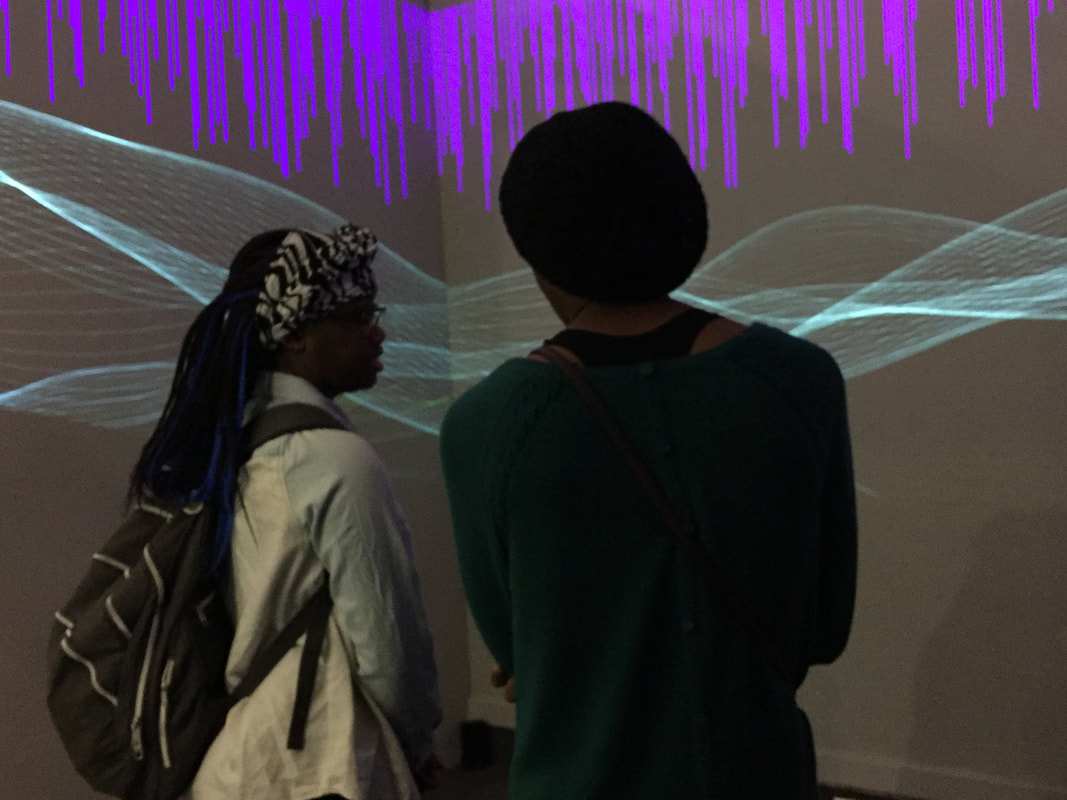
Installation View: Moltkerei Werkstatt, Cologne, Germany, 2013
2013: Moltkerei Werkstatt, Cologne, Germany
The installation (left) consisted of eight speakers, four on the bottom and four on the top. The bottom speakers are mapped sounds of the relative positions of seal relative to shark. The top speakers are mapped sounds of Sea Surface Temperature changes. Sitting in the middle of the room, the blindfolded audience becomes the shark, able to hear the seals' spatial and directional location (Fig. 1). These activities are submerged in the mapped sound of Sea Surface Temperature changes surrounding the shark covering an area of 121,000 km along the track.
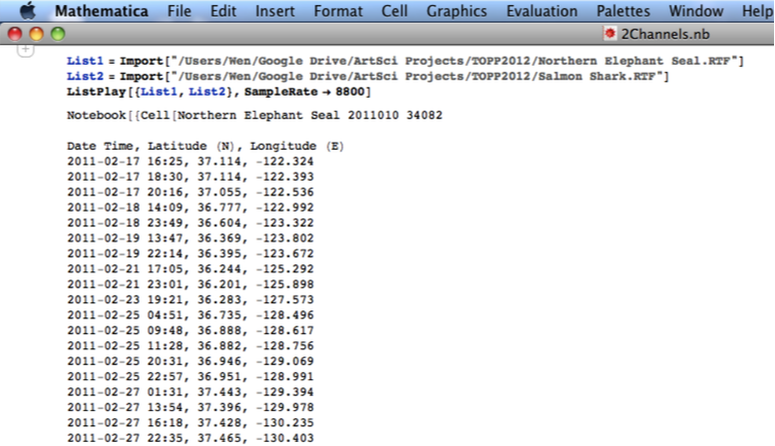
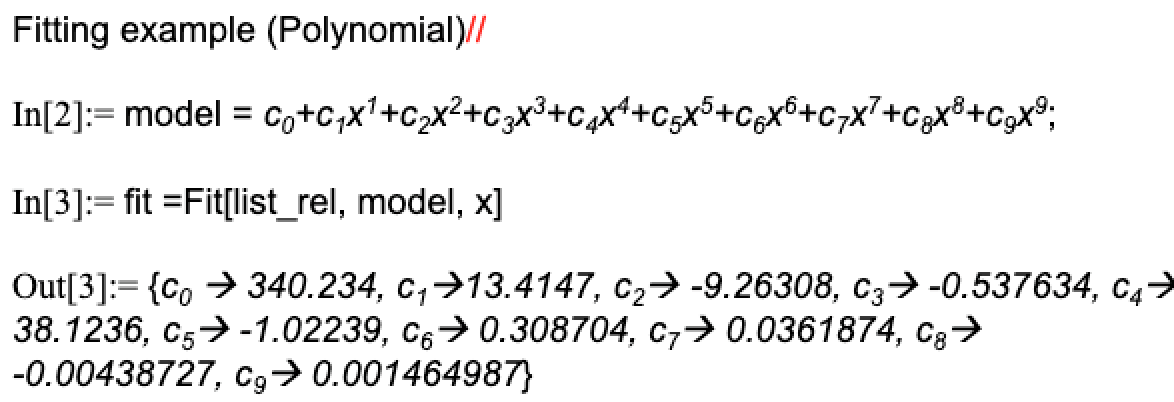
Data Mapping Method:- Mathematica to find the best-fit functions for migration tracks and SST data, which were then used to generate multi-dimensional sound channels.
- Fig. 1 Two-dimensional tags are fit into smooth curves to form migration tracks (seal relative to shark). Tracks are then mapped into the waveforms with subjective frequency assigned (within human audible spectrum).
- Fig.s 2-5 SST data is fit into smooth curves and then mapped into waveforms with subjective frequency assigned (within the human audible spectrum).
- Mapped animal track sounds are output from speakers on the floor.
- Mapped SST sounds are output from speakers above participants.
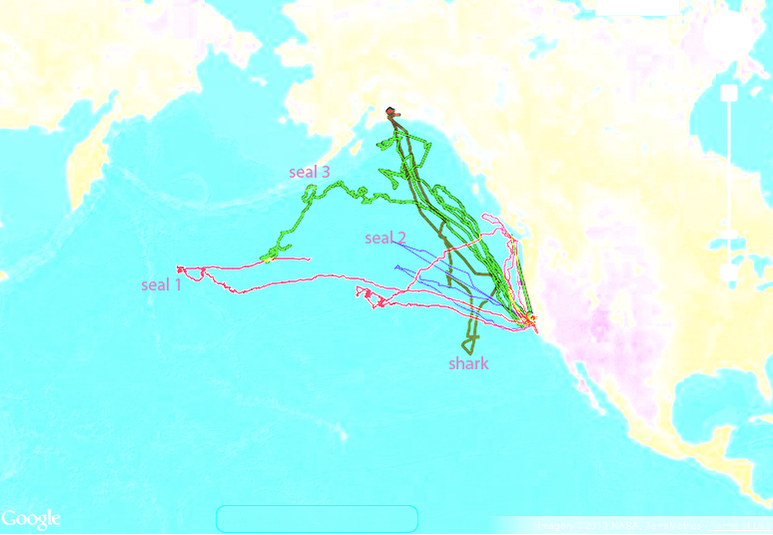
Fig 1. This map generated by TOPP provides a general idea of the migration of the animals.
|
|
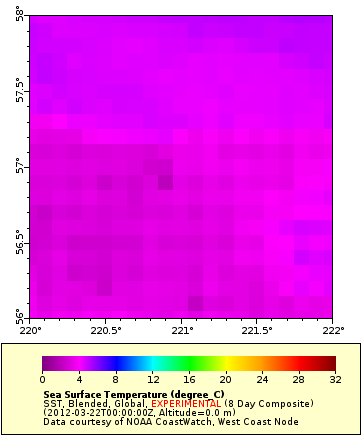
Fig 2. Example Graph of Sea Surface Temperature (SST) change (03. 22. 2012) generated by NOAA ERDDAP. [3]
Fig 4. Example Graph of Sea Surface Temperature (SST) change. (09. 22. 2012)
|
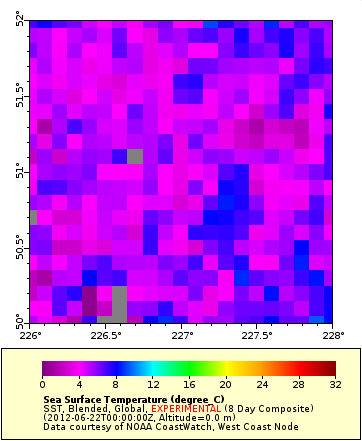
Fig 3. Example Graph of Sea Surface Temperature (SST) change (06. 22. 2012) generated by NOAA ERDDAP.
Fig 5. Example Graph of Sea Surface Temperature (SST) change (12 .22. 2012) generated by NOAA ERDDAP.
|


Installation documentation: West Florida University, FL
2017: TAG gallery, University of Florida, FL
Mapped Migration Activities:
A group of 6 Yellowfin tunas (average position)
Nearby fishing vessel activities
Sea Surface Change
Over one year period (Feb 15, 2013- Nov 16, 2013)
Mapped Migration Activities:
A group of 6 Yellowfin tunas (average position)
Nearby fishing vessel activities
Sea Surface Change
Over one year period (Feb 15, 2013- Nov 16, 2013)
Sample playback of fishing vessel activities provided by the Global Fishing Watching Organization.
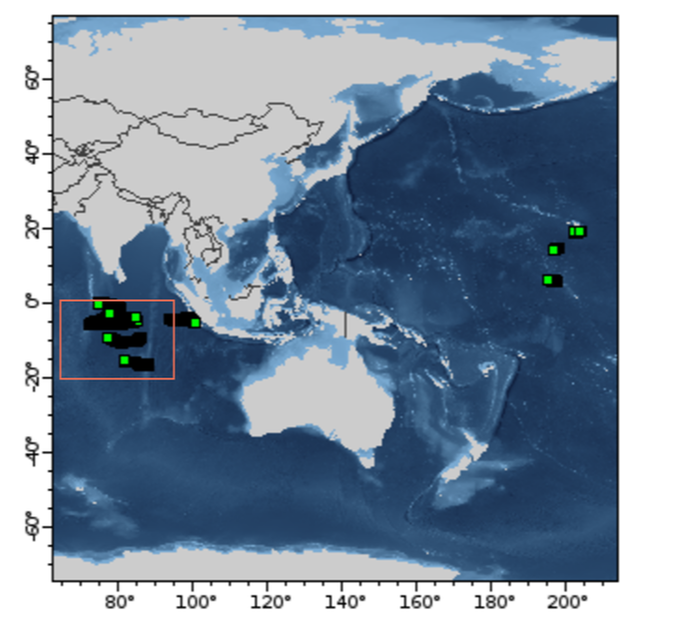
Location of the mapping area.
|
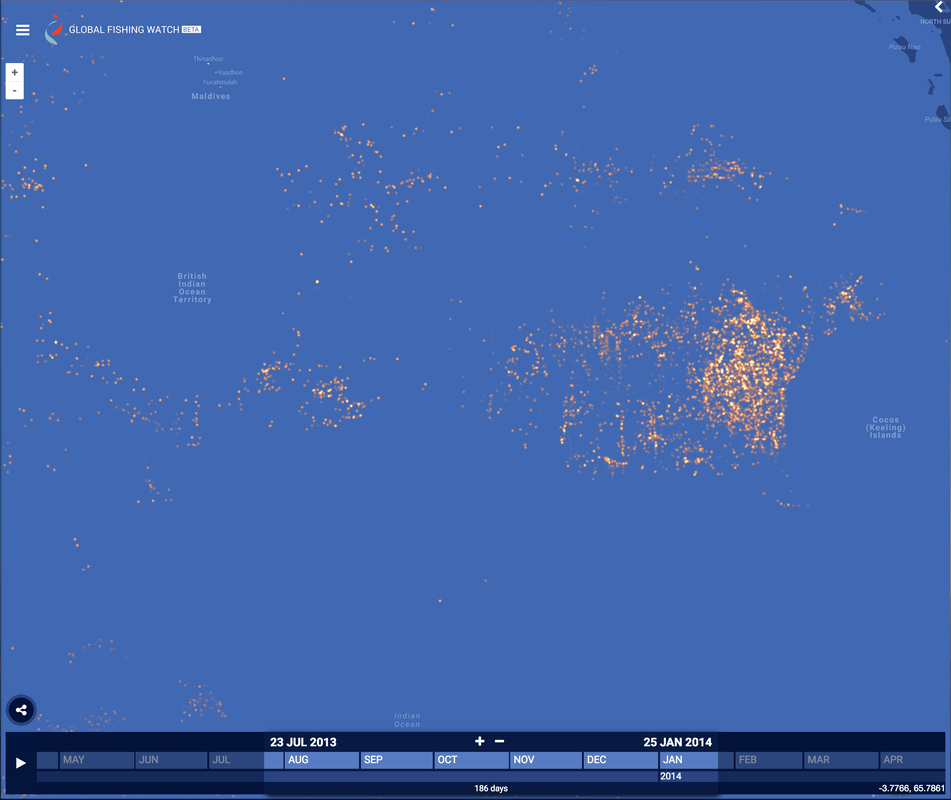
Mapped region fishing activities
|
Below is a diagram of the speaker arrangement in the immersive environment. You can click on the corresponding sound files on the right to get a sense of the sound representation from each speaker. Please keep in mind that in the actual installation the sound files were distributed dynamically using a 7.1 surround sound configuration. Therefore, it is impossible to understand the dynamics of the soundscape by only listening to the files in stereo as presented on this web page.
In order to calculate the relative migration tracks of the six tunas, we extracted individual datasets of tuna location, curve fit the tracks of tuna, and then calculated the relative locations to center of the tuna group.
In order to calculate the relative migration tracks of the six tunas, we extracted individual datasets of tuna location, curve fit the tracks of tuna, and then calculated the relative locations to center of the tuna group.
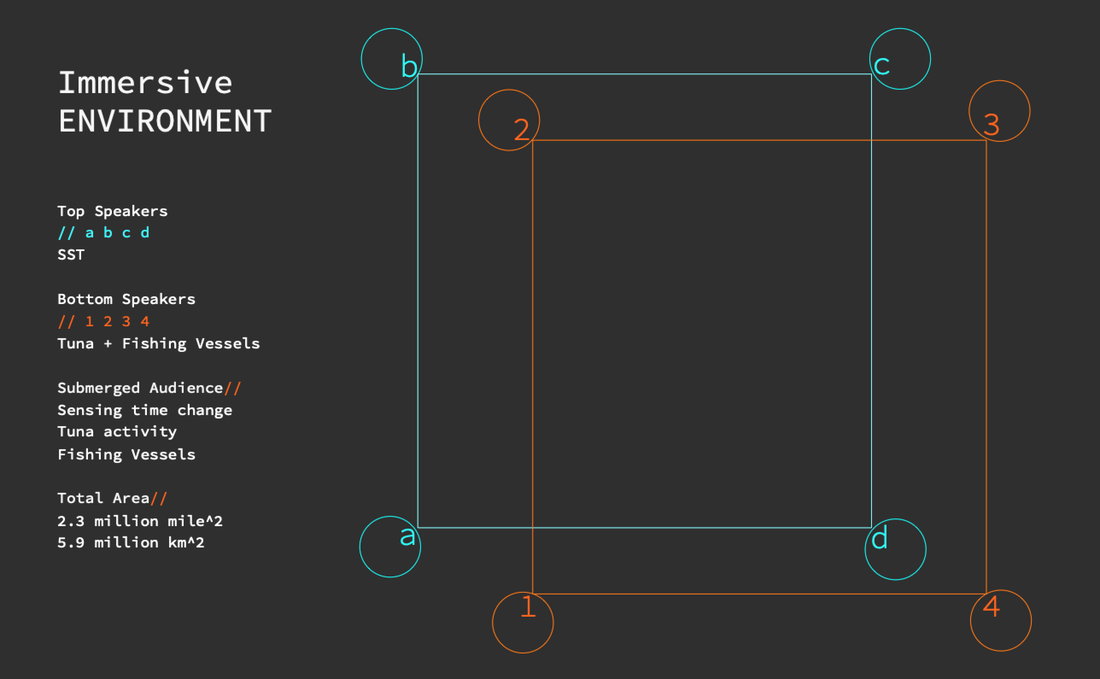
Diagram of the speaker arrangement in the immersive environment
|
| ||||||||||||||||
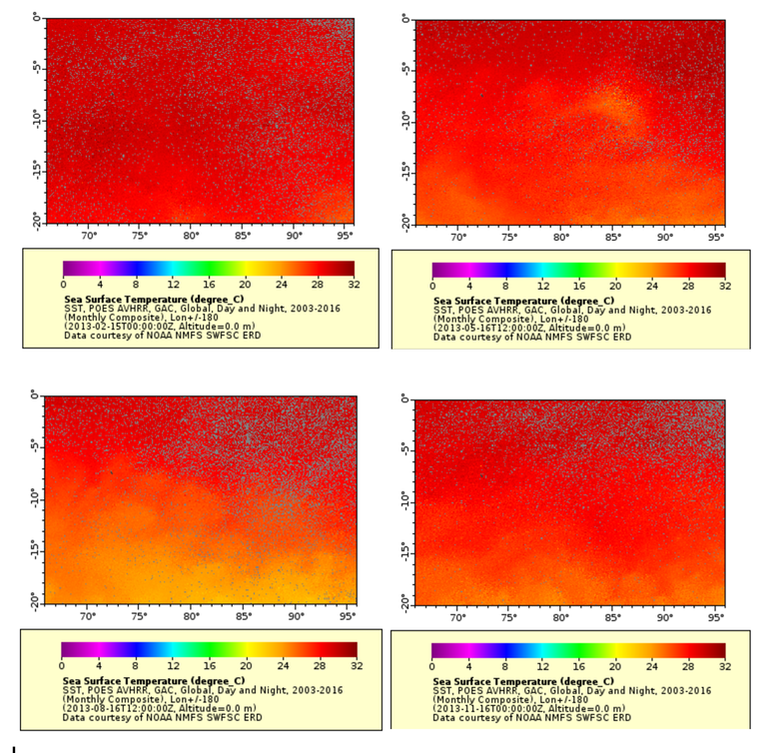
Sample Sea Surface Temperature graph 2013-02-15 to 2013-11-16
|
Installation view:
Sea Surface Change data mapped into colors in transition. |
References:
1 Barbara A. Block, Validation of geolocation estimates based on light level and sea surface temperature from electronic tags, (Marine Ecology Progress Series, 2004), Vol. 283: 81-98.
2. National Oceanic and Atmospheric Administration (NOAA) ERDDAP. 2012. <http://coastwatch.pfeg.noaa.gov/erddap/griddap/index.html?page=1&itemsPerPage=1000>
3. National Oceanic and Atmospheric Administration (NOAA) ERDDAP. 2012. <http://coastwatch.pfeg.noaa.gov/erddap/griddap/erdHadISST.graph>
4. Tagging of Pacific Predators (TOPP). 2016. <http://www.gtopp.org>
Acknowledgement:
We thank Dr. Barbara Block and Dr. Randy Kochevar of Marine Sciences, Stanford University, California, USA, for providing access to and assistance in understanding the data.
Copyright © 2019. Jiayi Young Studio. All rights reserved.